Epistemology & the Coronavirus
/The article seen below was written in early May 2020. It was a valid statement about uncertainties at the time. The epistemological need to admit we sometimes don’t know the answers to important questions is as right today as it was then.
However, subsequent developments filled in a lot of the blanks concerning the coronavirus and the covid-19 disease. The Center for Disease Control reported in October 2020 a careful tally of “excess deaths.”
As of October 15, 216,025 deaths from COVID-19 have been reported in the United States; however, this might underestimate the total impact of the pandemic on mortality.
Overall, an estimated 299,028 excess deaths occurred from late January through October 3, 2020, with 198,081 (66%) excess deaths attributed to COVID-19.
The CDC report didn’t say that 2.8 million deaths per year is the expected number, so the 299,028 excess deaths reported there represents about an 11% annual increase. That is less than the base rate of growth, so the national population continued to expand despite the disease.
Another important addition to our understanding of the disease is that contagiousness varies by the type of contact. The concept of the “superspreader event” entered our thinking during the summer and fall of 2020. Whatever the R0 (discussed below) of the the disease, it is less outdoors and more indoors, and especially high wherever people are close to each other and vocalizing. The worst type of events for spreading the disease are political rallies, sporting events, and choir practices! Here’s a part of another CDC report, discussing the deadly result of a choir practice in Washington State.
Among 61 persons who attended a March 10 choir practice at which one person was known to be symptomatic, 53 cases were identified, including 33 confirmed and 20 probable cases (secondary attack rates of 53.3% among confirmed cases and 86.7% among all cases). Three of the 53 persons who became ill were hospitalized (5.7%), and two died (3.7%).
The 2.5-hour singing practice provided several opportunities for droplet and fomite transmission, including members sitting close to one another, sharing snacks, and stacking chairs at the end of the practice. The act of singing, itself, might have contributed to transmission through emission of aerosols, which is affected by loudness of vocalization.
The mention of “fomite transmission” brings up a third point. Experts have learned that the disease transmits much more from airborne particles than from dry non-animate surfaces (fomites). The best advice coming from new information has evolved away from wiping everything over and over again, to washing hands often. Again, the CDC:
Some infections can be spread by exposure to virus in small droplets and particles that can linger in the air for minutes to hours. These transmissions occurred within enclosed spaces that had inadequate ventilation. Sometimes the infected person was breathing heavily, for example while singing or exercising.
Spread from touching surfaces is not thought to be a common way that COVID-19 spreads COVID-19 rarely spreads between people and animals
At the university where I was working at the time, most non-instructional staff (including me) were working from home. The building I normally worked in was all but vacant. Nevertheless, someone passed through all 10 floors of the building every day, disinfecting hundreds of doorknobs no one had touched or breathed on in months. It was a waste of effort. But the university continued the practice on the “Better safe than sorry” heuristic.
Below, I link to the rt.live website which estimates infectiousness of the coronavirus in each state. In early May, most states were below the critical threshold of 1.0. As I wrote this update, they were all at or above it.
The coronavirus pandemic provides a good opportunity to study epistemology. The disease and its effects on society are being closely studied by real experts and reported daily by conscientious journalists. But thanks to the very real limits of our ability to measure what happens and understand what we see, the pandemic is severely misunderstood.
I have written elsewhere that the most important epistemological skill for Americans is knowing how to judge what to believe and what not to. We’re exposed to a tremendous volume of information. Much of it is bogus, and even more is less correct than we’d like to suppose.
How many people have died of covid-19?
Except when a person disappears and no body is ever found, or in the very rare cases where a body is wrongly identified, there isn’t much dispute that a person is dead. And there is a thorough, consistent method of tallying death across the country. About 8,000 people die in America every day, and the doctors, coroners and morticians who deal with death are good at their jobs.
Every county in America has a process for reporting death. Someone (usually a doctor, but sometime a coroner or other investigator) fills out a death certificate to identify the person who died, the circumstances of their death and the exact cause of death. That document is passed on to the state department of health and eventually to the national Center for Disease Control. The CDC compiles and standardizes all the death reports for the whole nation, then studies the results and steers national health policy.
The CDC is a tremendous resource for information about health, disease and mortality in America. Any good information you see about health statistics for the nation comes from the CDC. (If it doesn’t, be suspicious!)
But the total number is the only detail that is straightforward and easy. Cause of death often is anything but simple. Here is an example of a death for which a doctor or coroner might have to determine a cause of death:
A 68-year-old woman is admitted to the ICU because of acute chest pain. She has a history of type 2 diabetes, hypertension, obesity, and angina. Over the next 24 hours an acute myocardial infarction is confirmed. Heart failure develops but improves with medical management. The patient then experiences a pulmonary embolus, confirmed by ventilation-perfusion lung scan and blood gases; over the next 2 hours she becomes unresponsive and dies.
Convoluted as it sounds, that was a fairly ordinary death. Most people would accept that the patient died of old age or natural causes. But the correct answer is: “pulmonary embolus due to acute myocardial infarction due to atherosclerotic heart disease.”
Many deaths create a problem for the person determining cause of death. What about if someone has a heart attack while driving and dies in the crash? What if they get stomach cramps from food poisoning while swimming and drown? What if a YouTube video of a kitten is so engrossing the person walks off the end of a boat and is bitten by a shark? Technically speaking, “The underlying cause of death refers to the disease or injury that initiated the train of morbid events leading directly to death or the circumstances of the accident or violence that produced the injury.” There is an element of art as well as science in cause of death decisions.
John Oliver contends in this amusing report that death certificates are often poorly filled out by unqualified or disreputable people. I’m sure he’s right about the instances he mentions. But his examples are in Florida, where that sort of thing tends to happen. In most communities, death certificates are handled well despite the difficulty of determining the true cause of death.
An entirely new cause like coronavirus must make determining cause of death harder than ever. Folk singer John Prine died in early April 2020 “after developing covid-19 symptoms.” Prine had been sick for more than 20 years and had had multiple surgeries to remove cancer from his neck and lungs. It would be hard to say whether the cancer or the virus “initiated the train of morbid events” that lead to his death. Remember that the link to covid-19 in Prine’s case is coming from a news network, and it only says Prine died after developing covid-like symptoms. His death certificate may say he died of covid-19, or it may say something else.
As if rightly determining cause of death weren’t already hard enough, the coronavirus pandemic brings politics into the mix, and that complicates the decision further. People are motivated for political reasons to either boost or downplay the number of covid-19 cases.
In early March, Donald Trump wished aloud that a Grand Princess cruise ship with stricken passengers would stay away from a California port, because he didn’t want those cases of covid-19 added to the US totals. Trump was callous. But other leaders have legitimate reasons to want their numbers to go up or down. A local hospital administrator wishing to get more tests and supplies might urge the coroners and doctors to classify every death from respiratory disease as a coronavirus death in order to dramatize their urgent need. A governor wishing to goose his or her state’s economy might be glad if marginal cases are classified as “lower respiratory disease,” a cause that kills 220,000 American every year.
Once every death has been classified more or less accurately, there comes the difficulty of compiling reports from all across the country. In ordinary times, it takes months to collect reports from all over, error-check them, and compile a national dataset. During the coronavirus crisis, the data collection process is moving faster than usual. And faster probably means less accurate.
Look at this chart, which I pulled from the excellent Johns Hopkins University website on May 2, 2020.
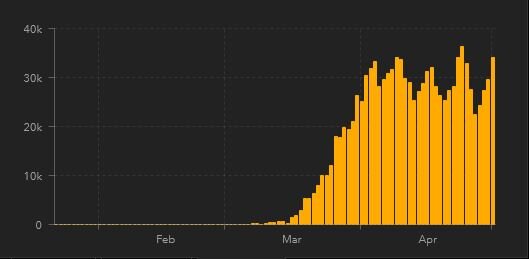
Source: Johns Hopkins University Coronavirus Dashboard
You can see the up-and-down pattern, with a peak once every seven days. From the beginning of April, this happened five times. This seems to suggest that more people die of covid-19 on Friday than on other days. Compare it to another chart, showing deaths from gun violence on each day of the week. This seems to suggest that gun violence happens on weekends more than weekdays.
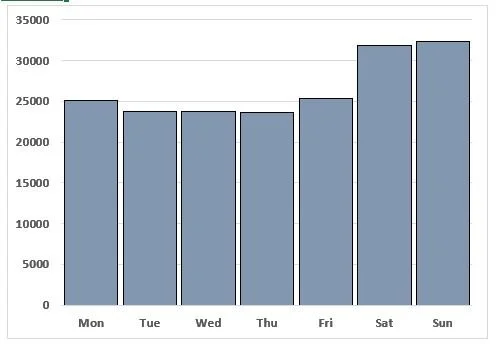
Source: Center for Disease Control
Yes. And no.
The apparent weekly cycle of the covid-19 data is just a glitch caused by the way the data are collected. Johns Hopkins is making an extraordinary effort to keep the information up-to-date. But some states and communities send in their data only once a week and the national total bumps when those show up. The gun violence chart, which I made from CDC data, shows a real pattern. Gun violence really does happen mostly on Friday and Saturday nights (and gets reported mostly on Saturday and Sunday). So the similar pattern in the two charts means something in one case and nothing in another case.
How deadly is Covid-19?
Everybody dies sooner or later. Nearly three million Americans die every year. That is a bit less than one percent of the population. As noted before, the Center for Disease Control provides very detailed information about how many people die in a year. The most common causes of death is always heart disease followed by cancer and then respiratory disease. The CDC also describes how the trends vary for people of different ages, races, genders, etc.
Society has taken a special interest in the novel coronavirus because of the possibility that the disease it causes — covid-19 — will boost that three million number to something a lot higher. But that will only happen if covid-19 is both very contagious and very deadly.
There are a few very noxious organisms — viruses, mostly — in the world that kill unusually high percentages of the people they infect. A dozen of the worst ones are listed in this link. The scariest are Ebola and something called Marburg virus, both of which kill 70% or more of the individuals who get infected. That rate of morbidity is so severe that the disease is easier to contain. People die so fast that they can’t spread the disease very far.
The mortality rate of covid-19 is unclear, and experts admit they aren’t sure. But as of late April 2020, their best guesses are in the range of 1% to 6%. Coronavirus is not among the super-deadly rare killers. It is worse than the common influenza, but it is not the bubonic plague.
The “best guesses” link above allows for a ranges from 1-6%, which is a huge margin. This is a case where the real experts are loath to give the precise answers that the media and the public are desperate to hear. The experts can’t calculate the death rate accurately because they don’t know how many people have been infected. They probably never will.
What appears to be very different rates of death from this disease, or any other disease, is often just a difference in how carefully the total number of cases has been counted. Suppose there is a community where 100 people have died. The mortality rate could be very different depending on how it is calculated.
The local hospital might say that 2,000 have been admitted to the coronavirus ward since the outbreak began. A ratio of 100 deaths per 2000 admitted cases is 5%.
A community health worker or an epidemiologist might survey the population and discover that 40,000 in the community have probably had the disease based on reported symptoms. Most of these would be mild cases not requiring a visit to hospital. So the ratio looks like 100 deaths per 40,000 cases. That would mean the disease kills only one quarter of one percent (0.25%).
These two estimates of the morbidity rate of the disease are wildly far apart. But they are both legitimate and reasonable way of accounting for the disease. I don’t know which is closer to the truth. I don’t claim either is. The only thing I’m sure of is that every estimate out there is based on assumptions. Most estimates are imprecise, and some are wrong by a tremendous margin. That isn’t said to disparage or disrespect the medical professionals or the epidemiologists. It is just a fact wherever massive data is being collected and reported in a hurry.
How contagious is the coronavirus?
To understanding the pandemic, we also need to know how contagious the virus is. And that means we have to measure, out of all the people who are exposed to the disease, how many end up getting it. There’s a scientific term for this, which is R0. There is not a widely accepted method of measuring it.
The R0 is simple to understand. It is the number of people that one person with the disease is likely to infect. If the R0 is 1, then one sick person will infect one other person. That is enough to keep the disease going. If the R0 is greater than 1, then the disease (absent any interventions) will infect a larger share of the population over time. An R0 of less than 1 means most people who are sick will infect no one else, and the disease will dwindle out on its own.
So it is absolutely critical that we know the R0 of covid-19.
And . . . we don’t.
It isn’t possible to say how many people have been exposed to the coronavirus. If there were enough tests to test every person in the country we could begin to know how may people have it. But that wouldn’t tell us how many have been exposed to it and didn’t catch it.
The experts develop models (which are sophisticated guesses based on assumptions). But nobody knows for sure, and nobody ever will.
For familiar diseases like measles, the experts say with confidence that the R0 is somewhere between 12 and 18. That means that each person who has it spreads it to 12 or more other people. For coronavirus, the estimates are all over the place. Germany says it is 0.8. France says their rigorous policies have forced the R0 down from 3.3 to 0.5. For the US , here is a website that estimates the R0 for each state. As I write this, six states have an R0 greater than 1. The range of error on these guesses is pretty wide because of inadequate testing, so the estimates allow that as many as 39 states may have an R0 greater than 1. So, let’s say it this way: the model provides confidence that only 11 states have an R0 less than 1.
I should note that the R0 is shaped by the conditions of society. The low R0 for coronavirus reflect the quarantine policies. That value would almost surely increase in a more open society. One of the unhappy consequences of our data-rich, but epistemologically poor modern society is that the same evidence will be used by both side of the argument. Some will point to the low R0 and say, “We succeeded in controlling a very dangerous threat.” Others will look at it and say, “The low R0 proves it never was as dangerous as they said.”
Two More Wildcards
In addition to the factors already described, two additional factors are very important in understanding the coronavirus threat.
First is immunity. With most other viral diseases, a person who had the disease in the past carries antibodies that prevent them from getting it ever again. Dr. Anthony Fauci has stated repeatedly that nobody knows whether the novel coronavirus will behave the same way. Millions of people have had the disease and have recovered. It would be great to think that they are now immune. But, because the disease is a new one, we aren’t sure.
The second thing is a vaccine or other preventive treatment. There isn’t one. If there was a way of knowing if and when an effective vaccine will be available, the whole pandemic would be easier to understand and easier to deal with. Some experts are saying a vaccine is at least a year and a half away. That is based on past efforts to produce vaccines for new diseases. There’s no guarantee that the same timeline applies for the novel coronavirus.
My purpose here has not been to convince you that coronavirus is more serious than you thought, or less serious than you thought. I don’t know much, and I know I don’t.
My purpose has been to show that, from an epistemological perspective, there are hard limits to how much can be known. The people in charge (in most states, at least) have made difficult and necessary decisions. And they should have. The pandemic is an occasion for decisive actions. But you shouldn’t think those decisions were based on perfect information.


